Start improving with Life QI today
Full access to all Life QI features and a support team excited to help you. Quality improvement has never been easier.

Organisation already using Life QI?
Sign-up
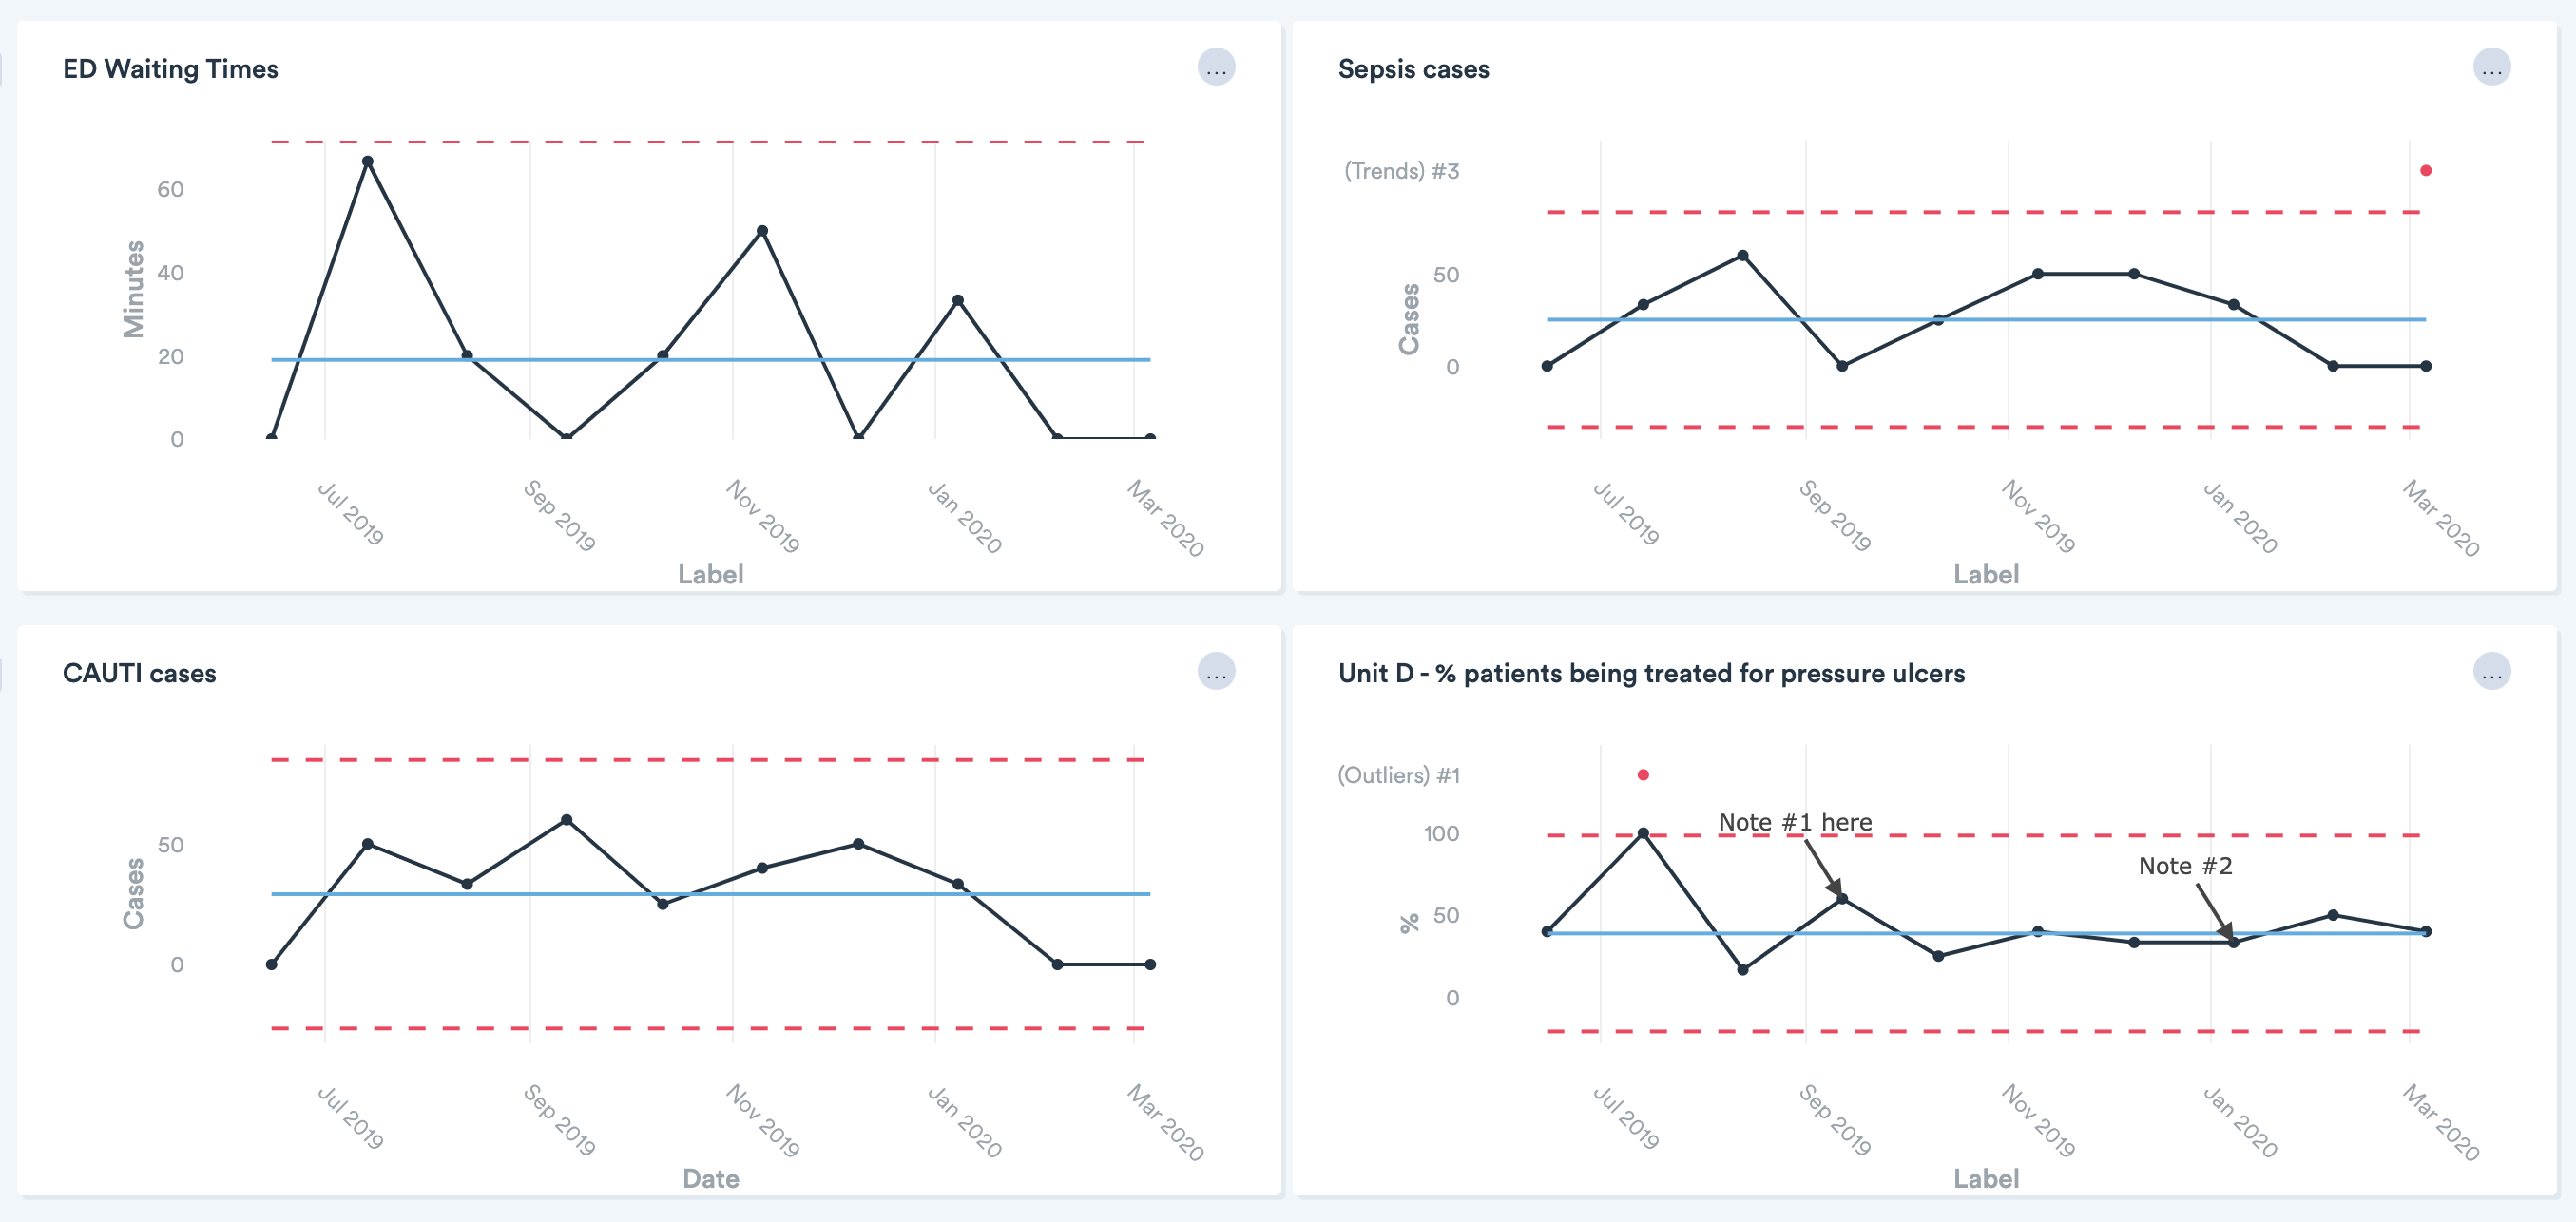
Track your quality metrics/indicators all together in one place with Life QI’s updated Analytics.
Improvement is only one part of the wider quality management system operating at all times within healthcare organisations. Whilst data over time is crucial for improvement (so we know the changes we make result in improvements) often that very same data needs to be monitored outside of the ‘improvement phase’ as part of your ongoing quality monitoring activities. To assist with the overlap in data for monitoring and data for improvement, we are updating the Analytics capabilities of Life QI to make it possible to setup quality metric monitoring dashboards.
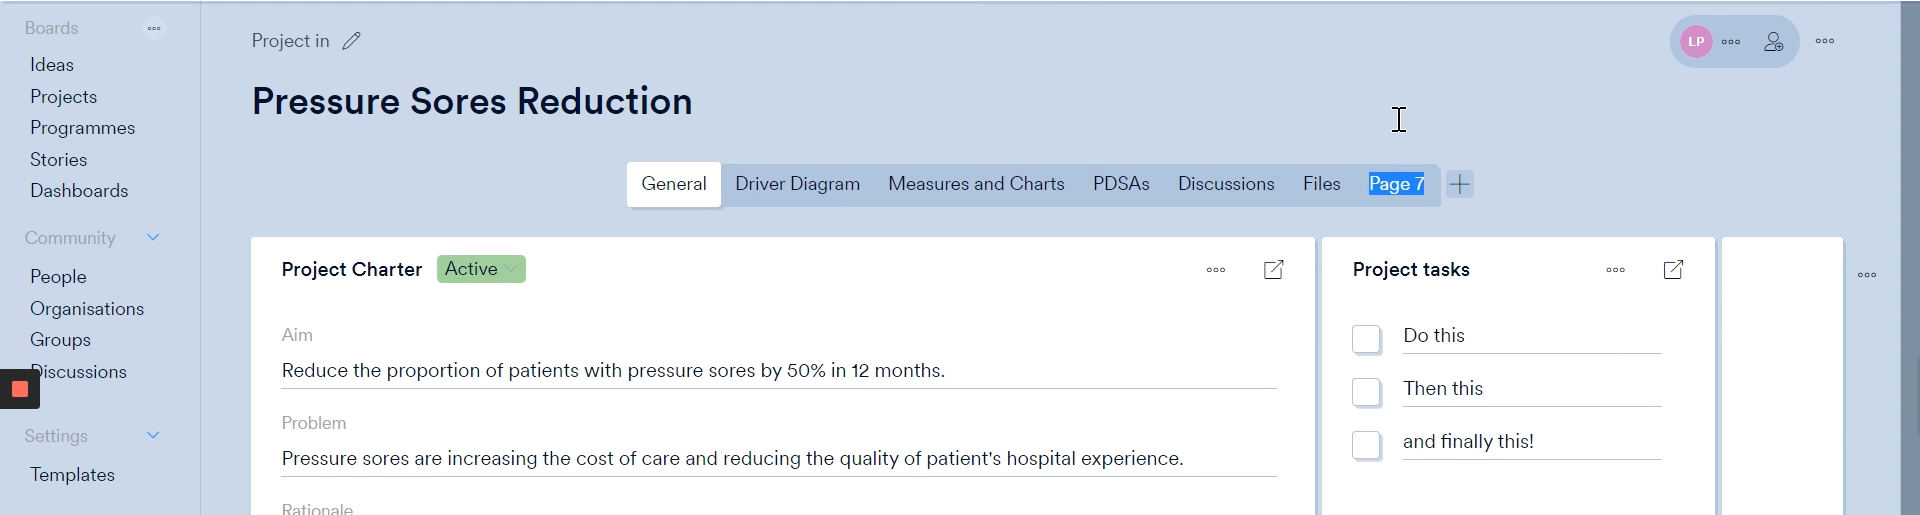
This will make it possible to create collections of charts used for monitoring and/or improvement. The charts and data will live in the Analytics area, so you don’t have to create a project to setup a chart anymore. The charts can be used for monitoring purposes, and then if you notice a decline in quality that requires improvement (i.e. special cause variation is detected), a project can be started and the relevant quality metrics can auto-populate charts in the project. Having this data displayed in two places allows the project team to have a project level view of the metric(s) they are working to improve, whilst over in Analytics you can continue to monitor the metrics without any need for duplicate data entry. The data is only ever being entered once but can be displayed in as many places in Life QI as you want – great hey!
This allows one person/team to be responsible for data entry of a metric into Life QI (this could be routine copy/paste of data or automated using our API), then as many people as needed in the organisation can make use of the data by pulling it into their idea board or project.
For those using the Life QI API for data integration, this will allow monitoring data to easily co-exist with all improvement work and data. Plus, we have auditing functionality coming soon, so you will also be able to manage that work in the same place as your monitoring and improvement work – the complete quality management solution!
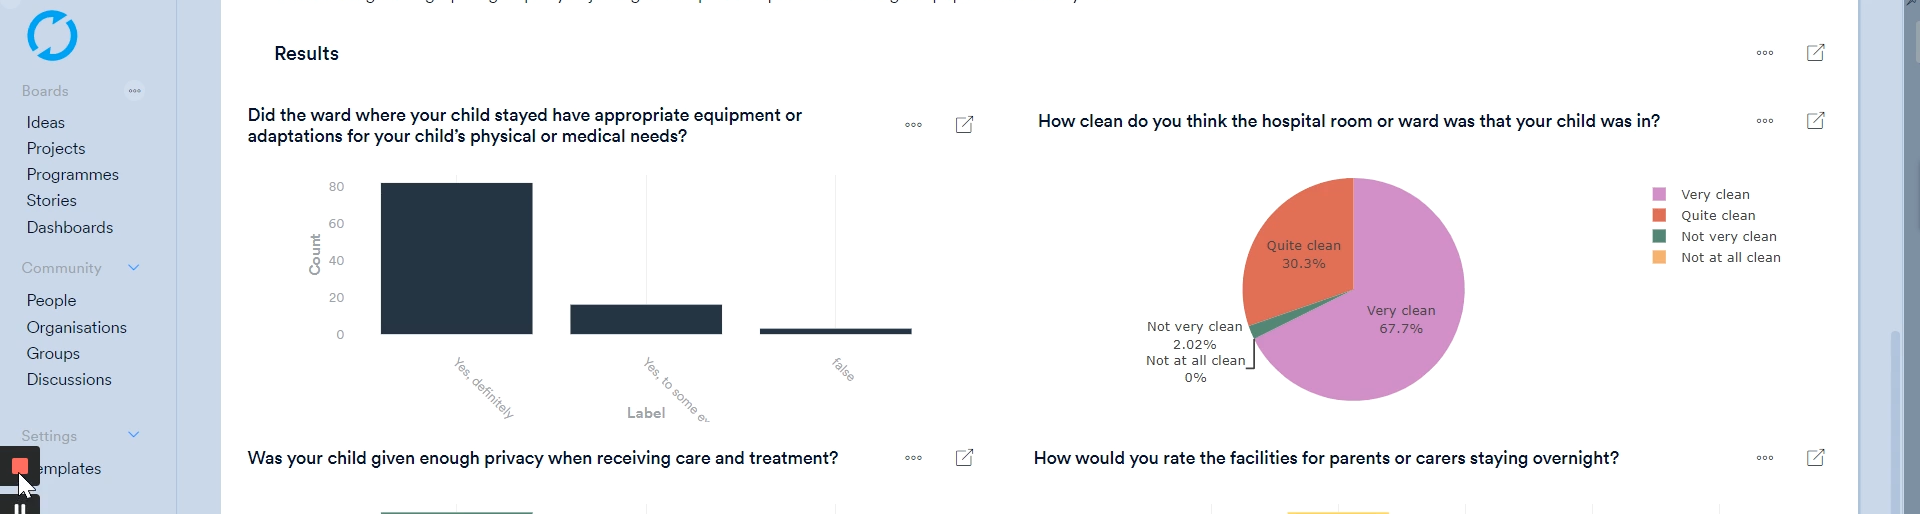
These quality metric charts can be combined with the existing Analytics charts and metrics so you can combine the impact data of quality metrics with the activity and progress data of the existing Analytics dashboards. Thus, providing more rounded and complete healthcare improvement analytics.
Full access to all Life QI features and a support team excited to help you. Quality improvement has never been easier.
Organisation already using Life QI?
Sign-up