Start improving with Life QI today
Full access to all Life QI features and a support team excited to help you. Quality improvement has never been easier.

Organisation already using Life QI?
Sign-up
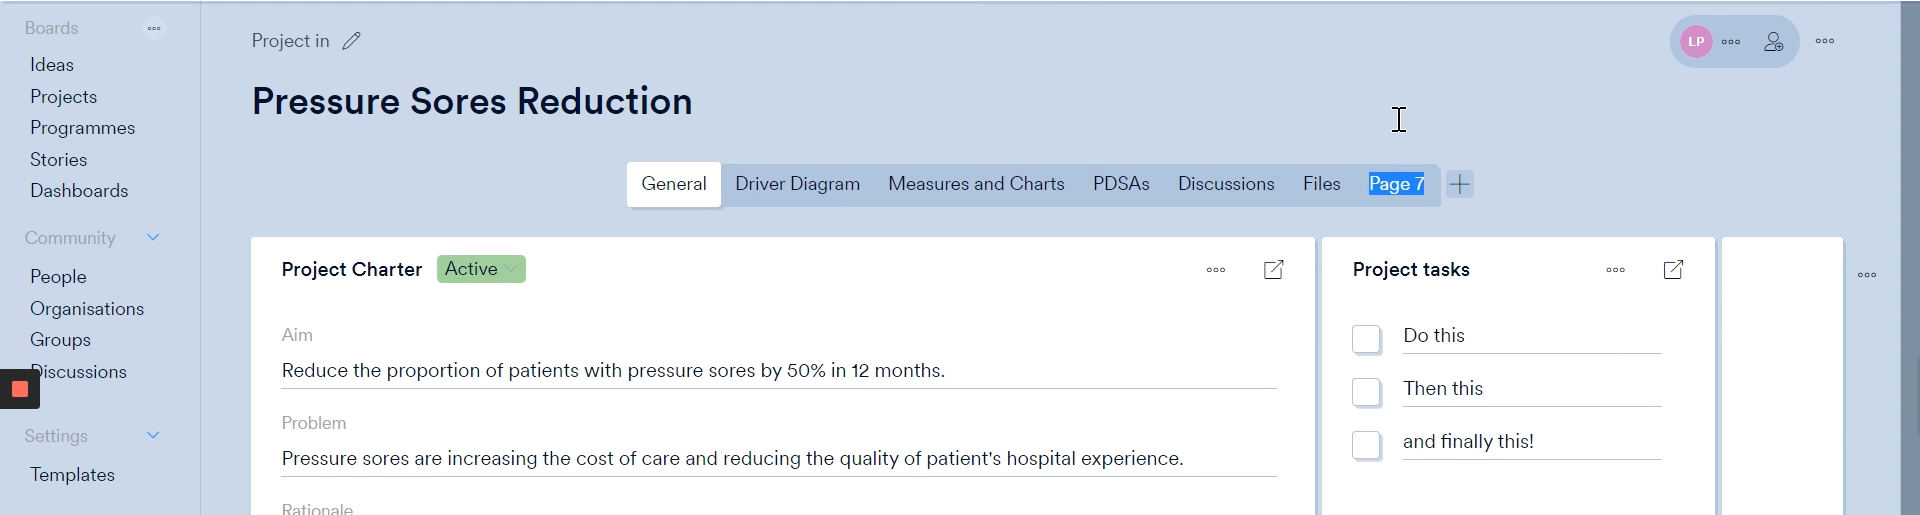
The way charts are listed on a page is changing. Each chart will be contained in a card (which looks a bit like a tile), the front of the card will show the chart in a preview mode so you can see the chart. By clicking on the card, it will expand so you can interact with it (add data, edit the chart etc.).
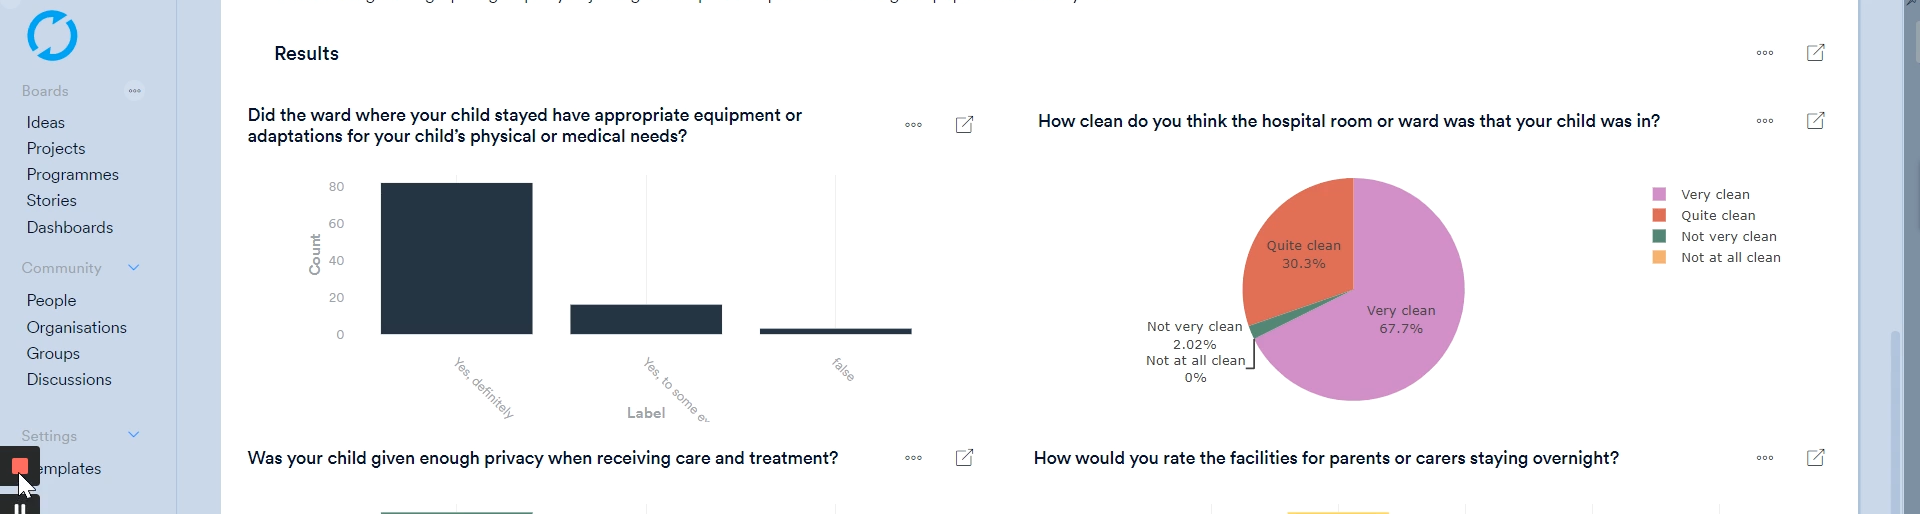
This move to ‘chart cards’ means you will be able to see all your charts on a single page – without having to open each chart separately to get a look at them. This brings a number of benefits that we are excited to share with you:
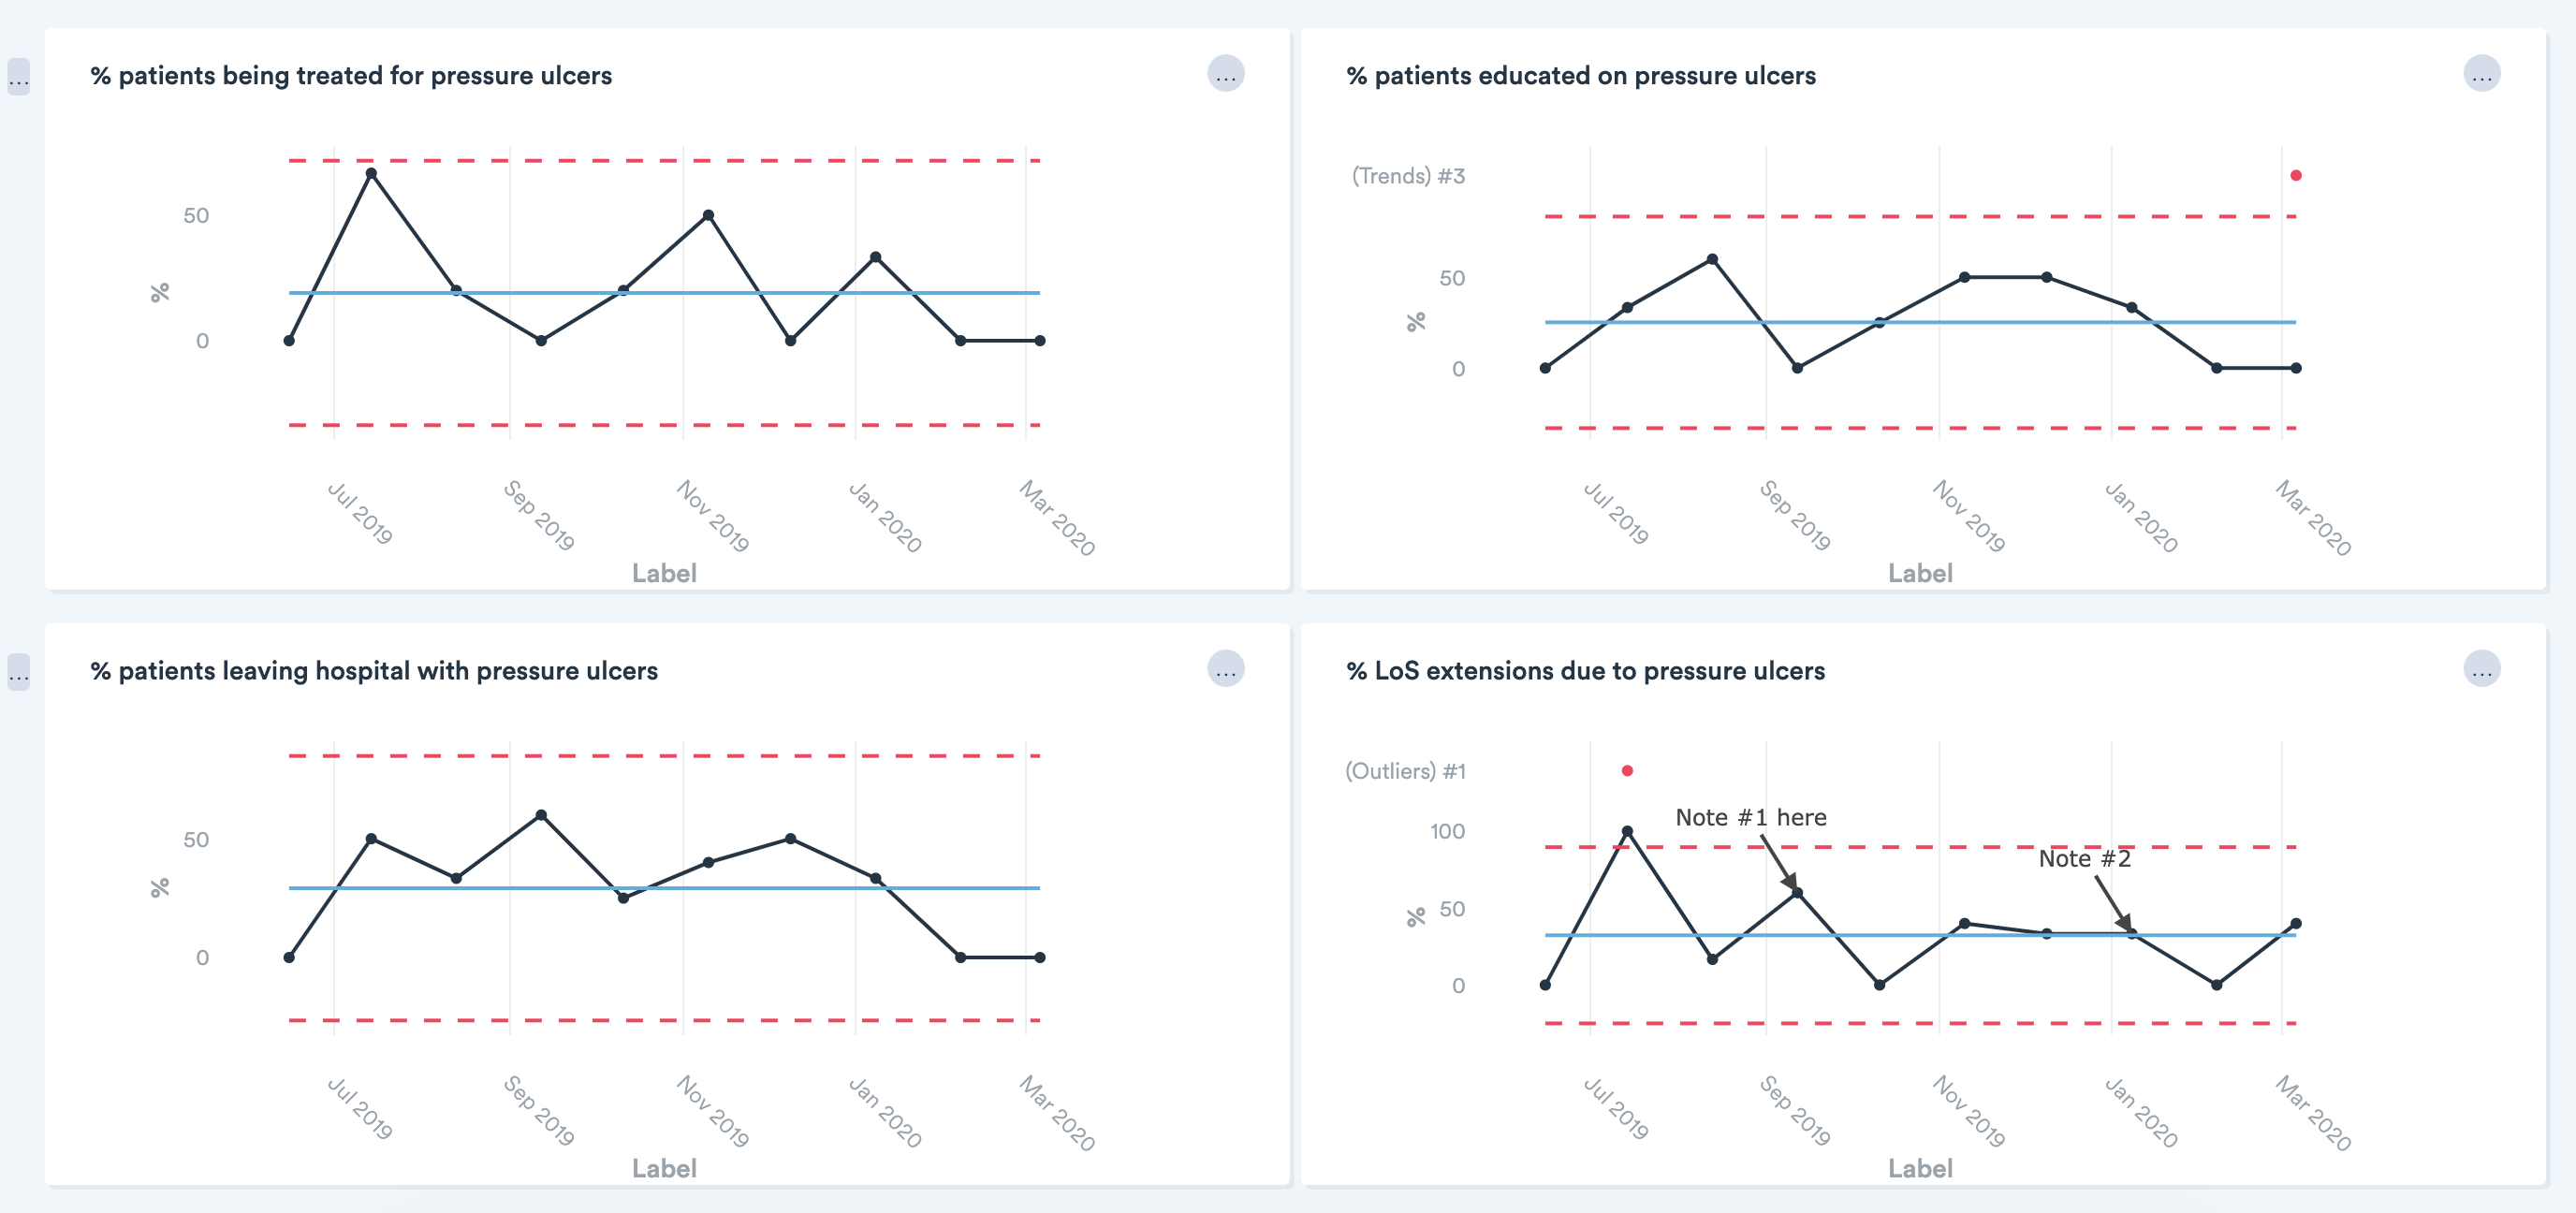
With all your charts displayed on one page a high-level evaluation of all charts to look for trends and special cause variation is possible in a matter of seconds, with no clicking into and out of individual charts. If you do need to review a chart in more detail (or make changes), just click on it to dive in.
We are always looking for ways to make it easier and quicker for you to access the data you are interested in. This move to cards reduces the number of clicks needed to get to the full view of chart where you can interact with it. Less clicks means more time for analysis and evaluation – allowing you to focus your time on the important stuff.
As part of the move to chart cards you will have the ability to re-size and re-order chart cards so you can draw attention to key charts. Giving you complete control of how your data is displayed.

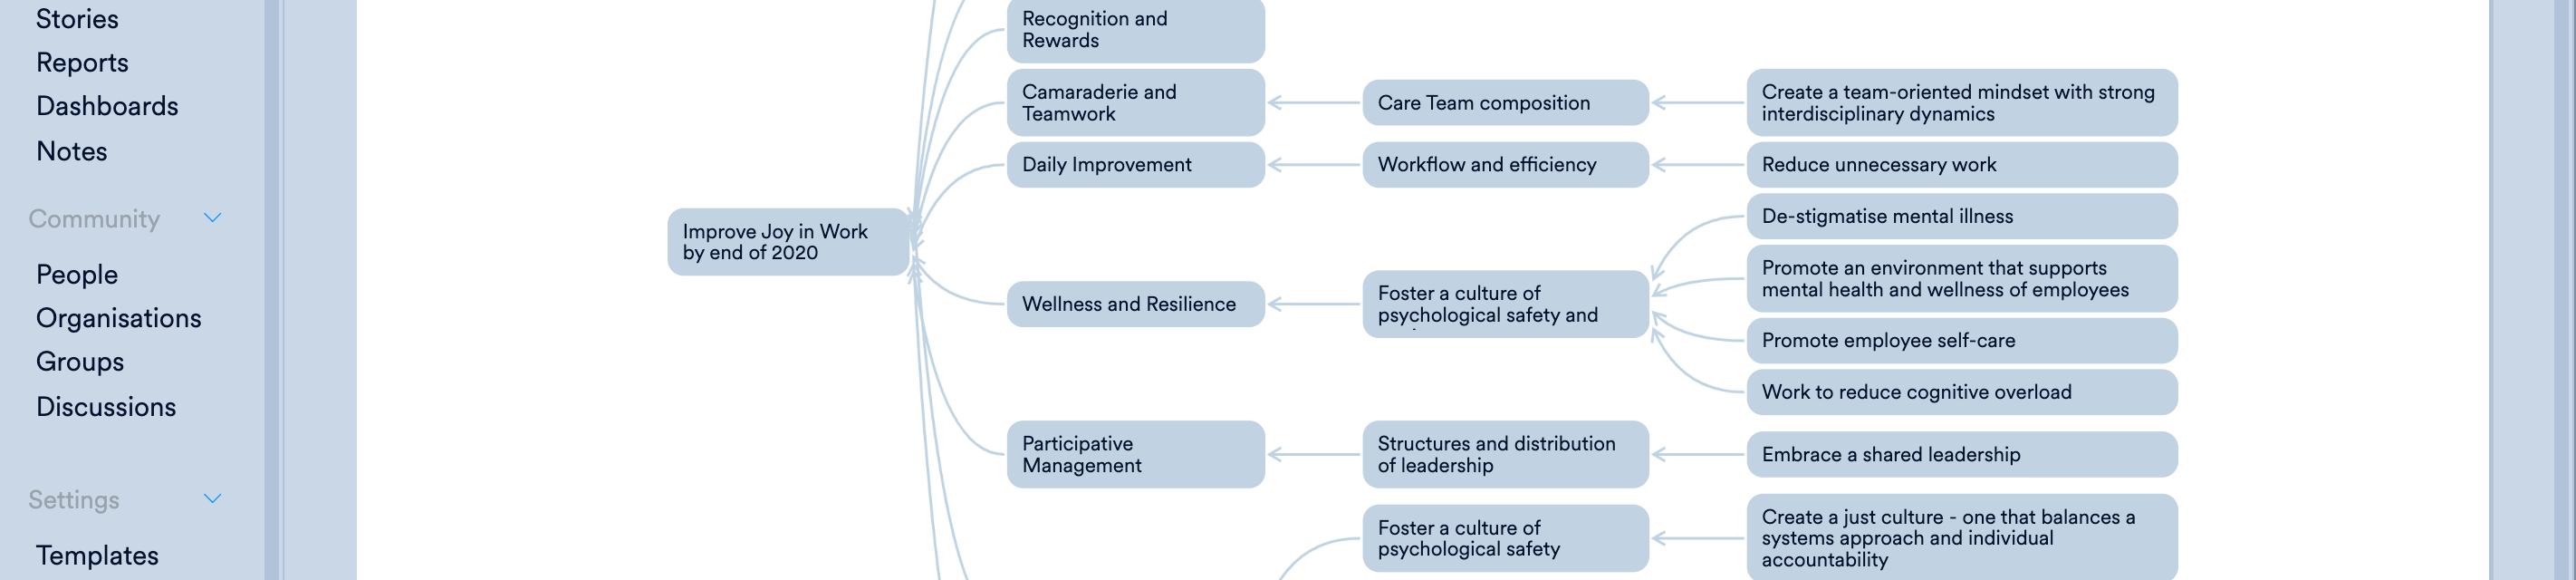
This move to chart cards will be applied wherever charts appear in Life QI - on Projects, Programmes, Analytics, and in the new Ideas area.
Full access to all Life QI features and a support team excited to help you. Quality improvement has never been easier.
Organisation already using Life QI?
Sign-up