Start improving with Life QI today
Full access to all Life QI features and a support team excited to help you. Quality improvement has never been easier.

Organisation already using Life QI?
Sign-up
We are pleased to introduce the first of a range of new tools that will be released later in 2020 ... Pareto charts! It is one of the most commonly requested tools not currently available in Life QI, so we have decided to change that.
Pareto charts are often used in the early stages of a project to help the team identify the inputs and changes that will have the greatest impact.
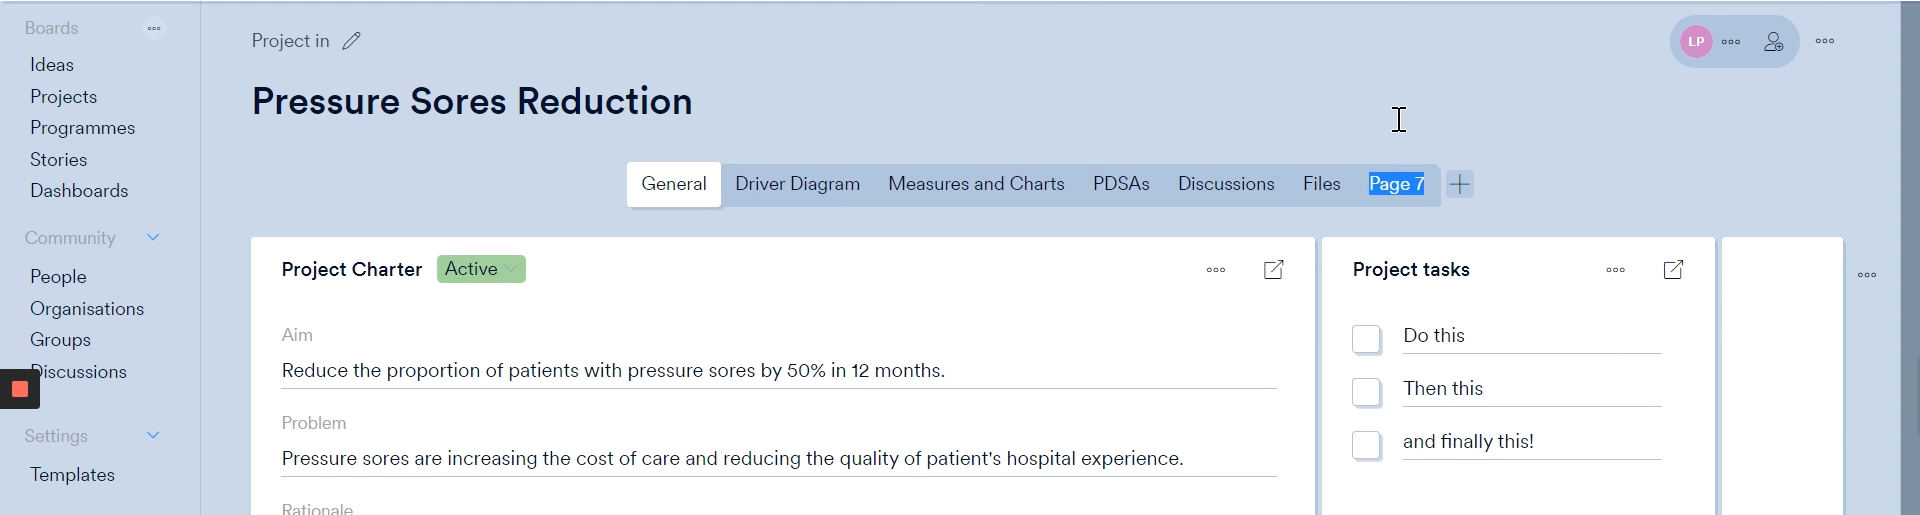
We will be making Pareto charts available both within Projects, but also within the new Workbooks area. Teams that have begun their project but want to still want to analyse where to focus will be able to create a Pareto chart within their project. If however you haven't started a project and are still in the design and route-cause phase, you will be able to create a Pareto chart in a Workbook (along with other charts) before progressing to the project stage.
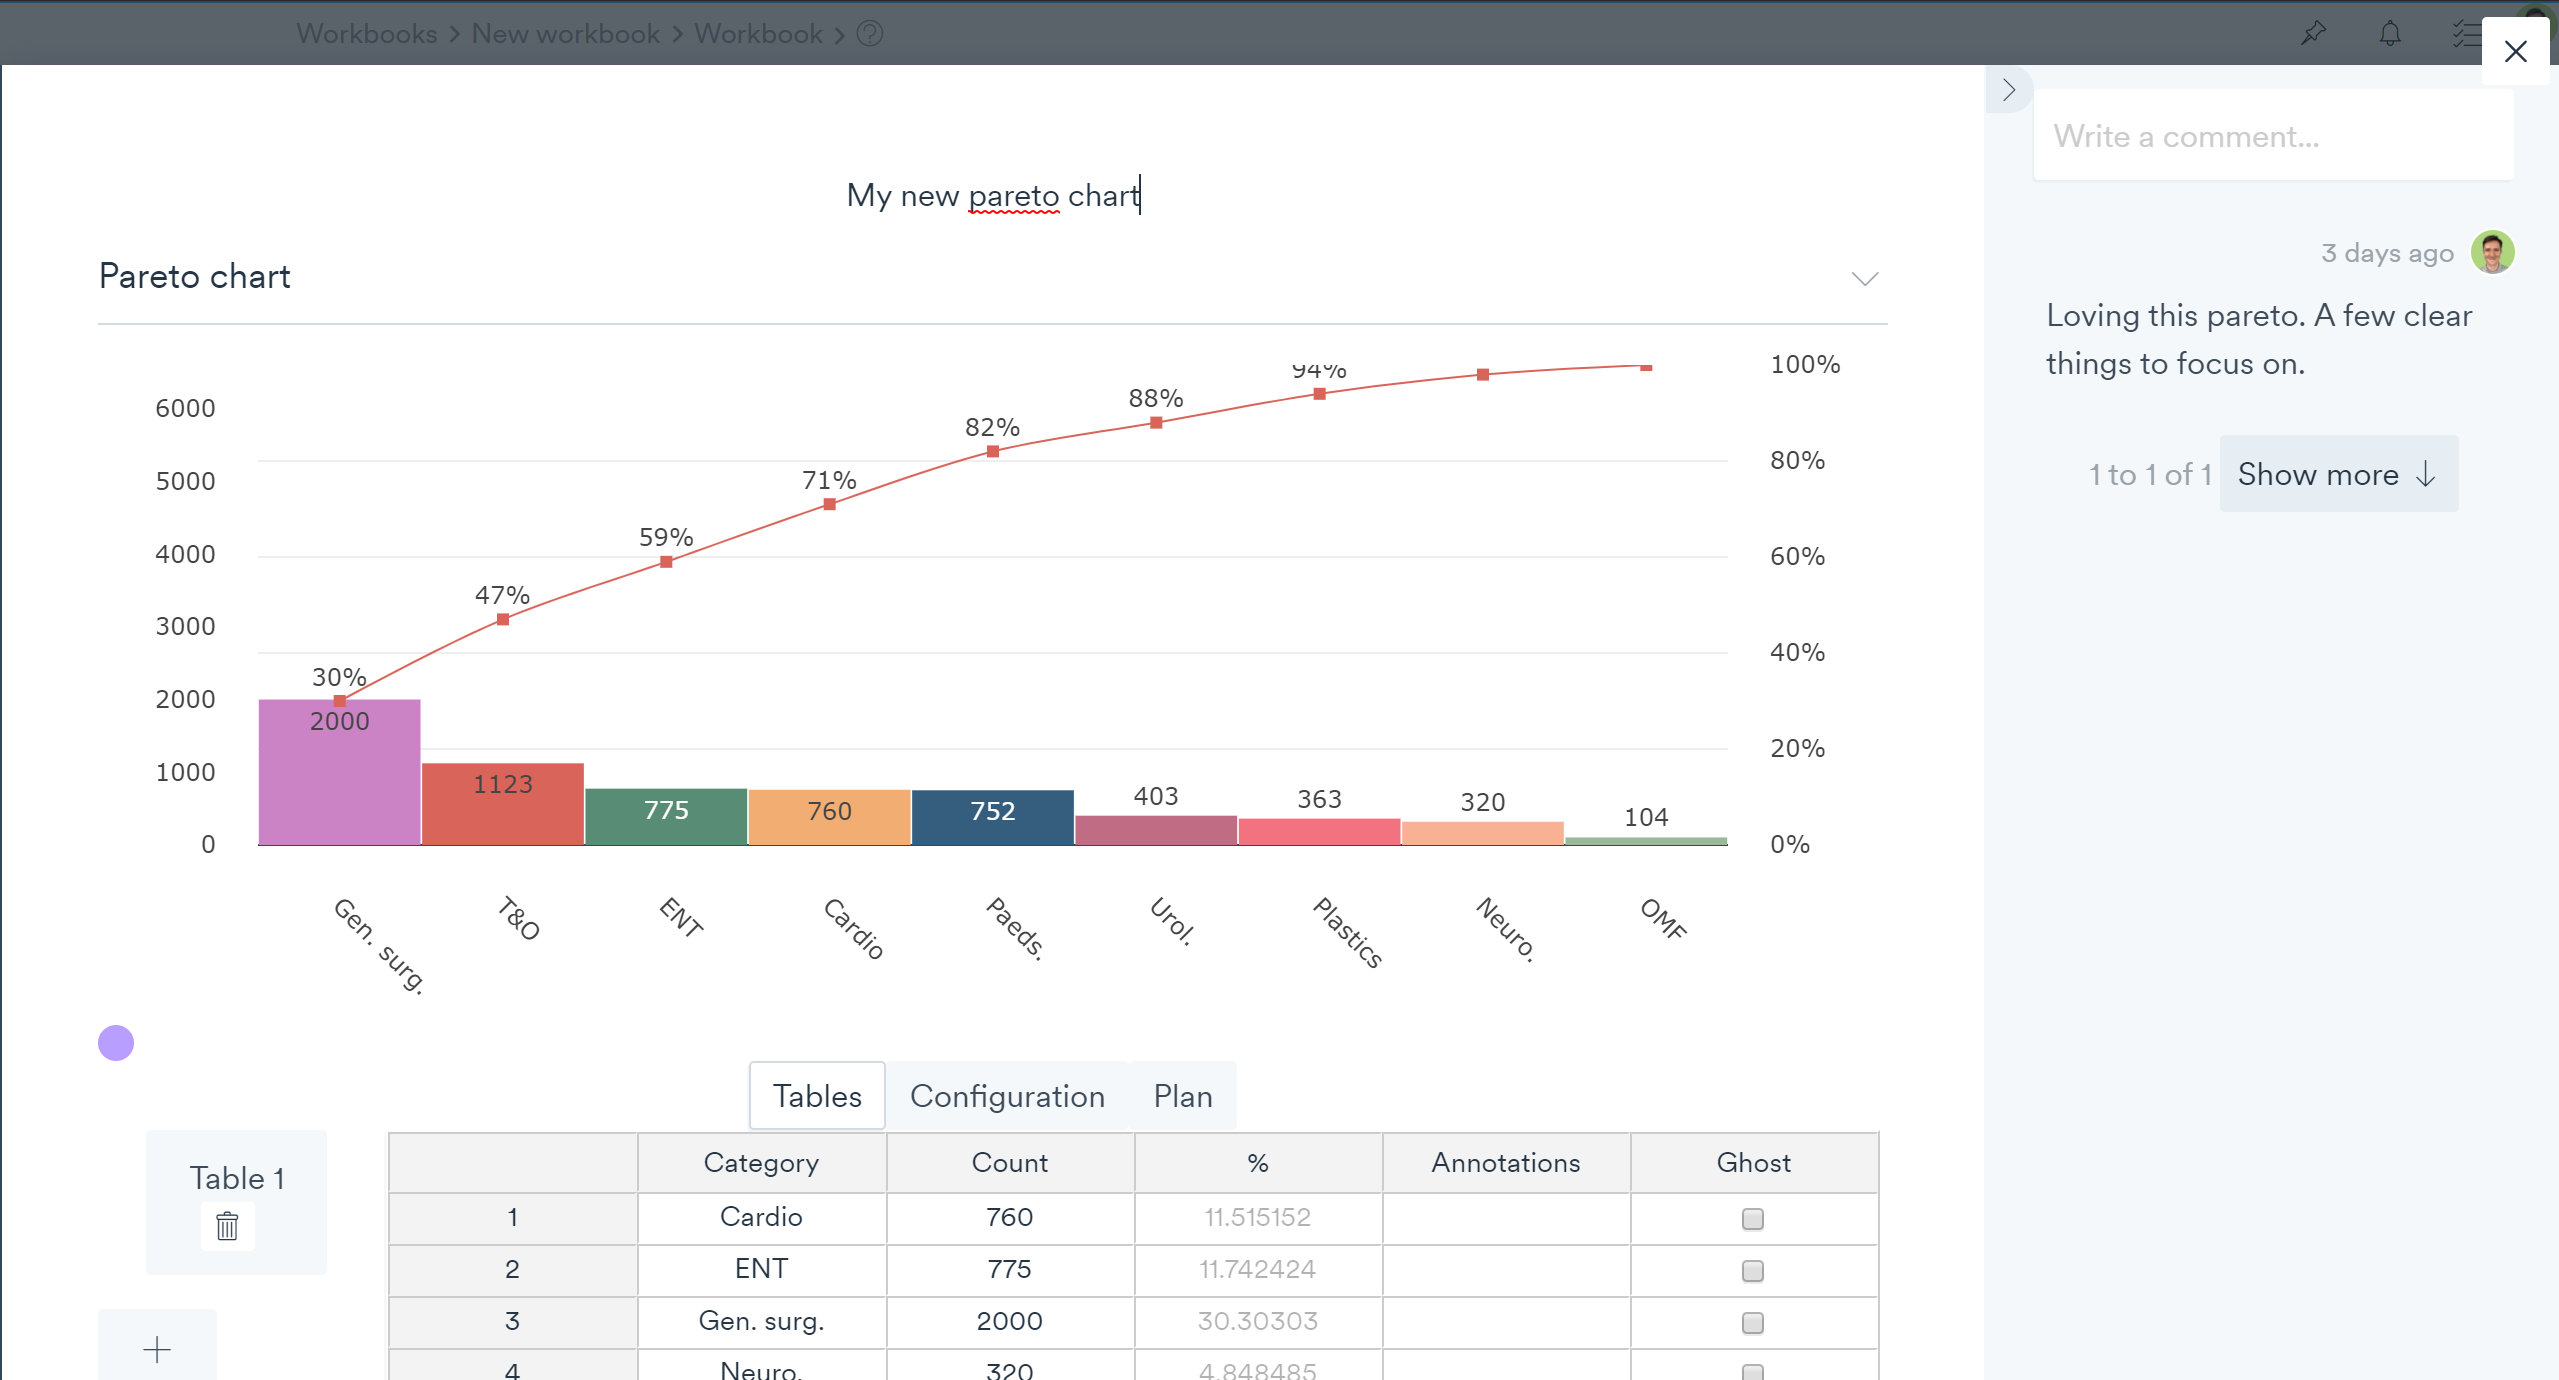
Further details of the Pareto tool will be shared as the functionality is finalised, but for now here is a sneak peek screenshot of the 'work in progress' Life QI Pareto chart:
Stay tuned for more updates on new and improved features ...
Full access to all Life QI features and a support team excited to help you. Quality improvement has never been easier.
Organisation already using Life QI?
Sign-up