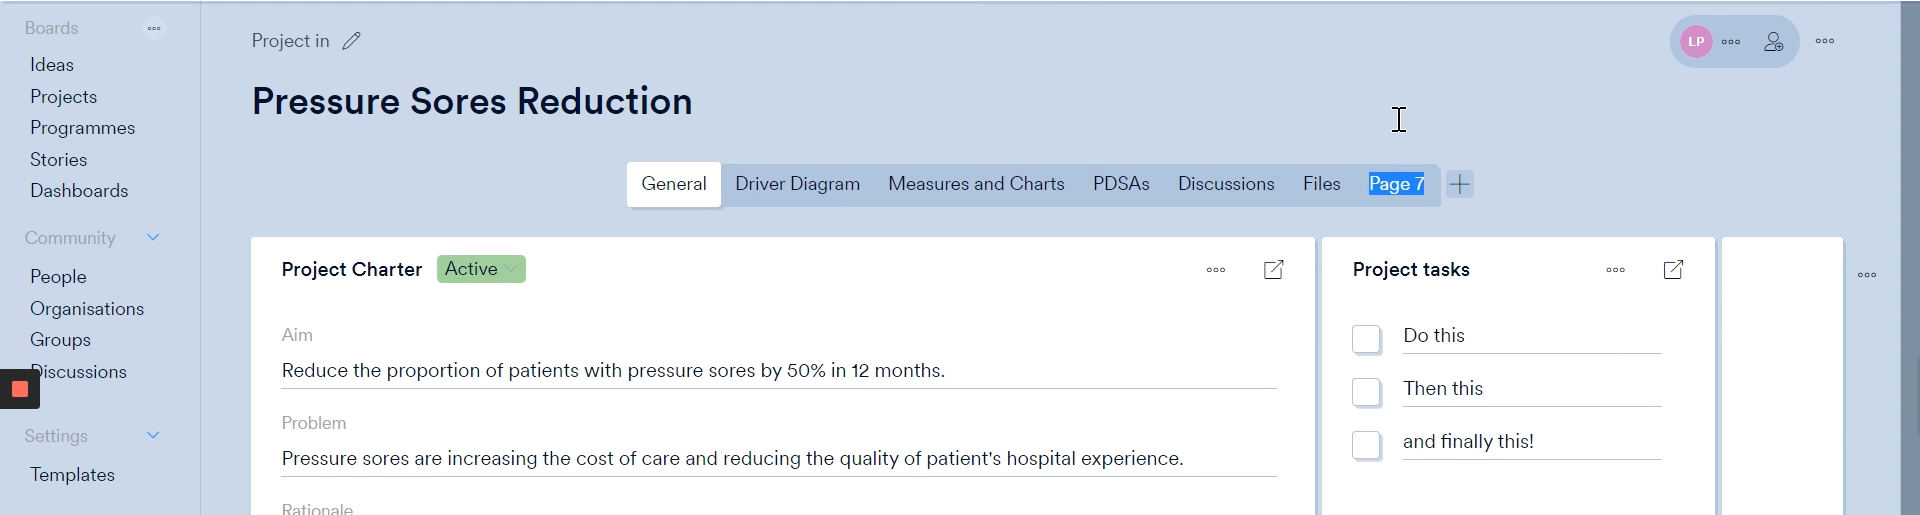
Tailor your improvement project

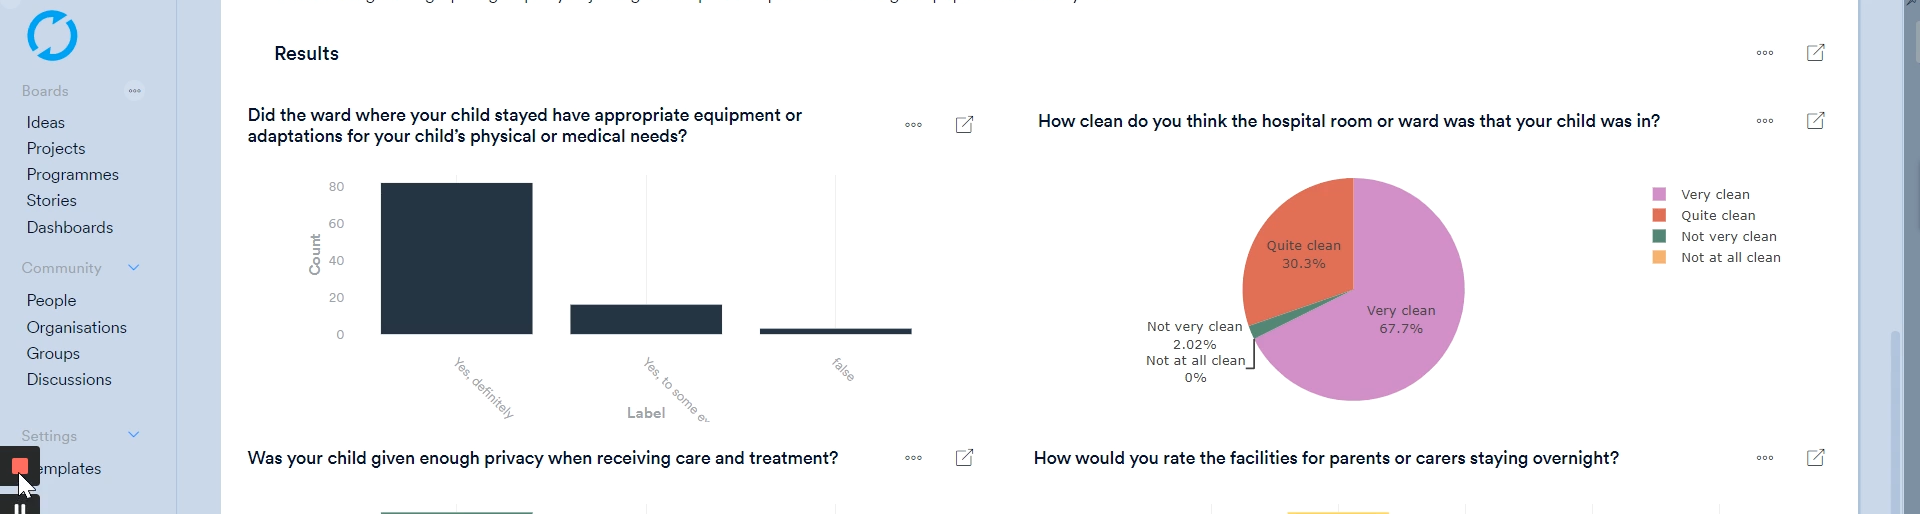
Charting your survey results
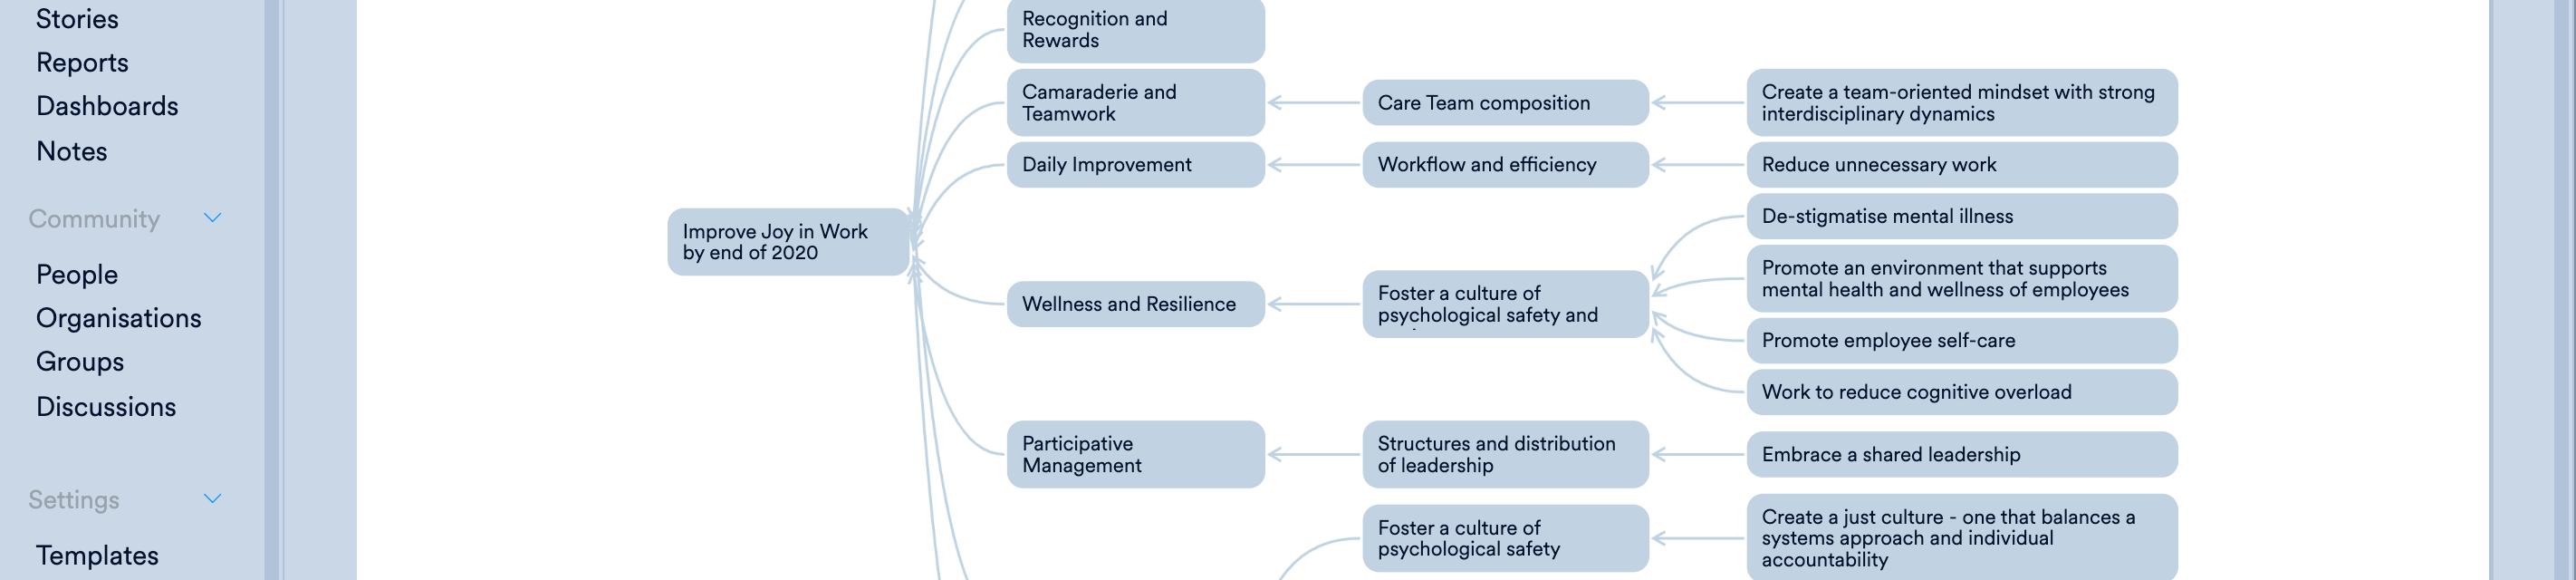
Upgraded Driver Diagram

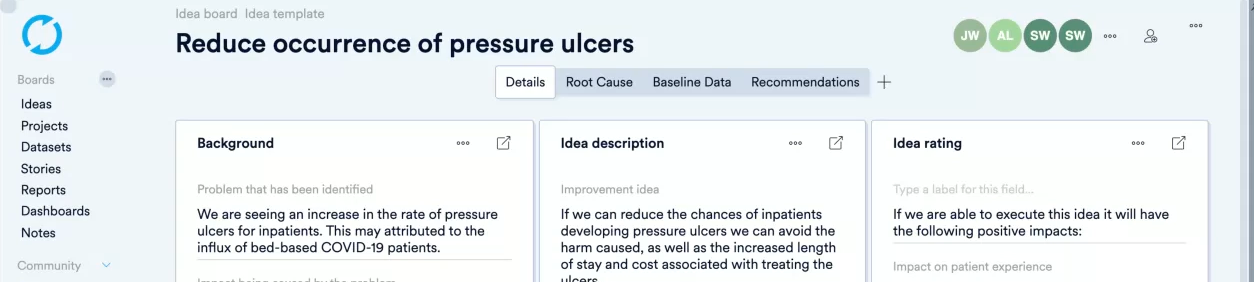
Capture, share and develop improvement ideas
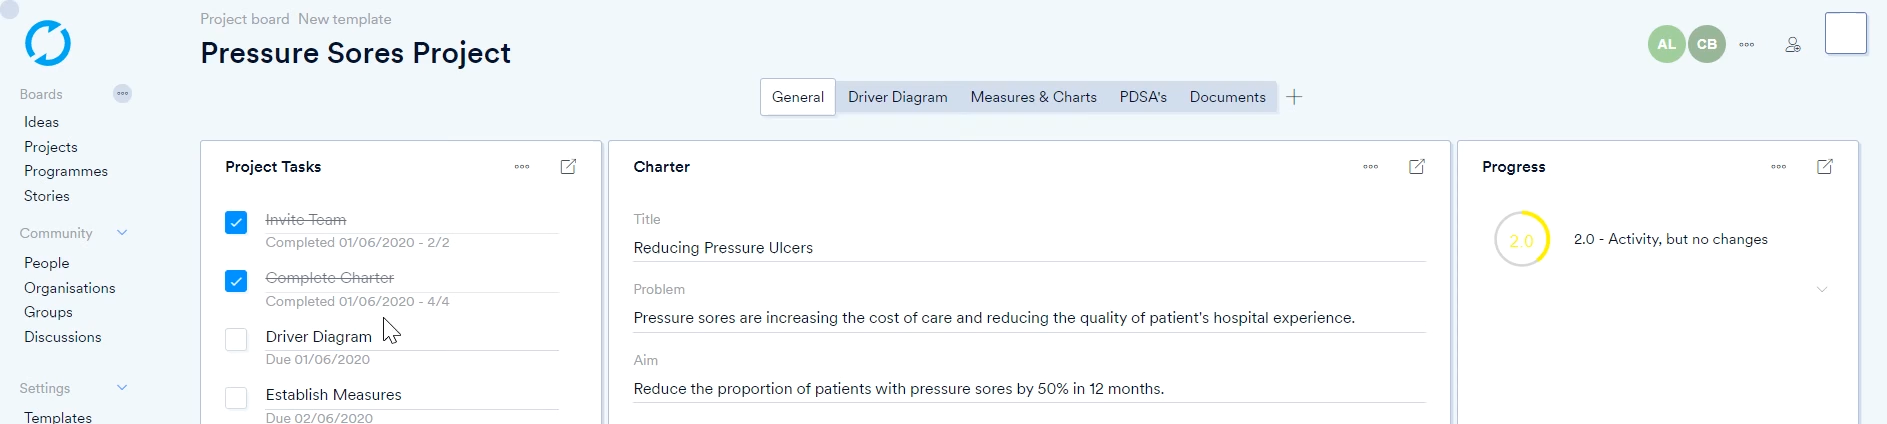
Time to get organised with Task Lists
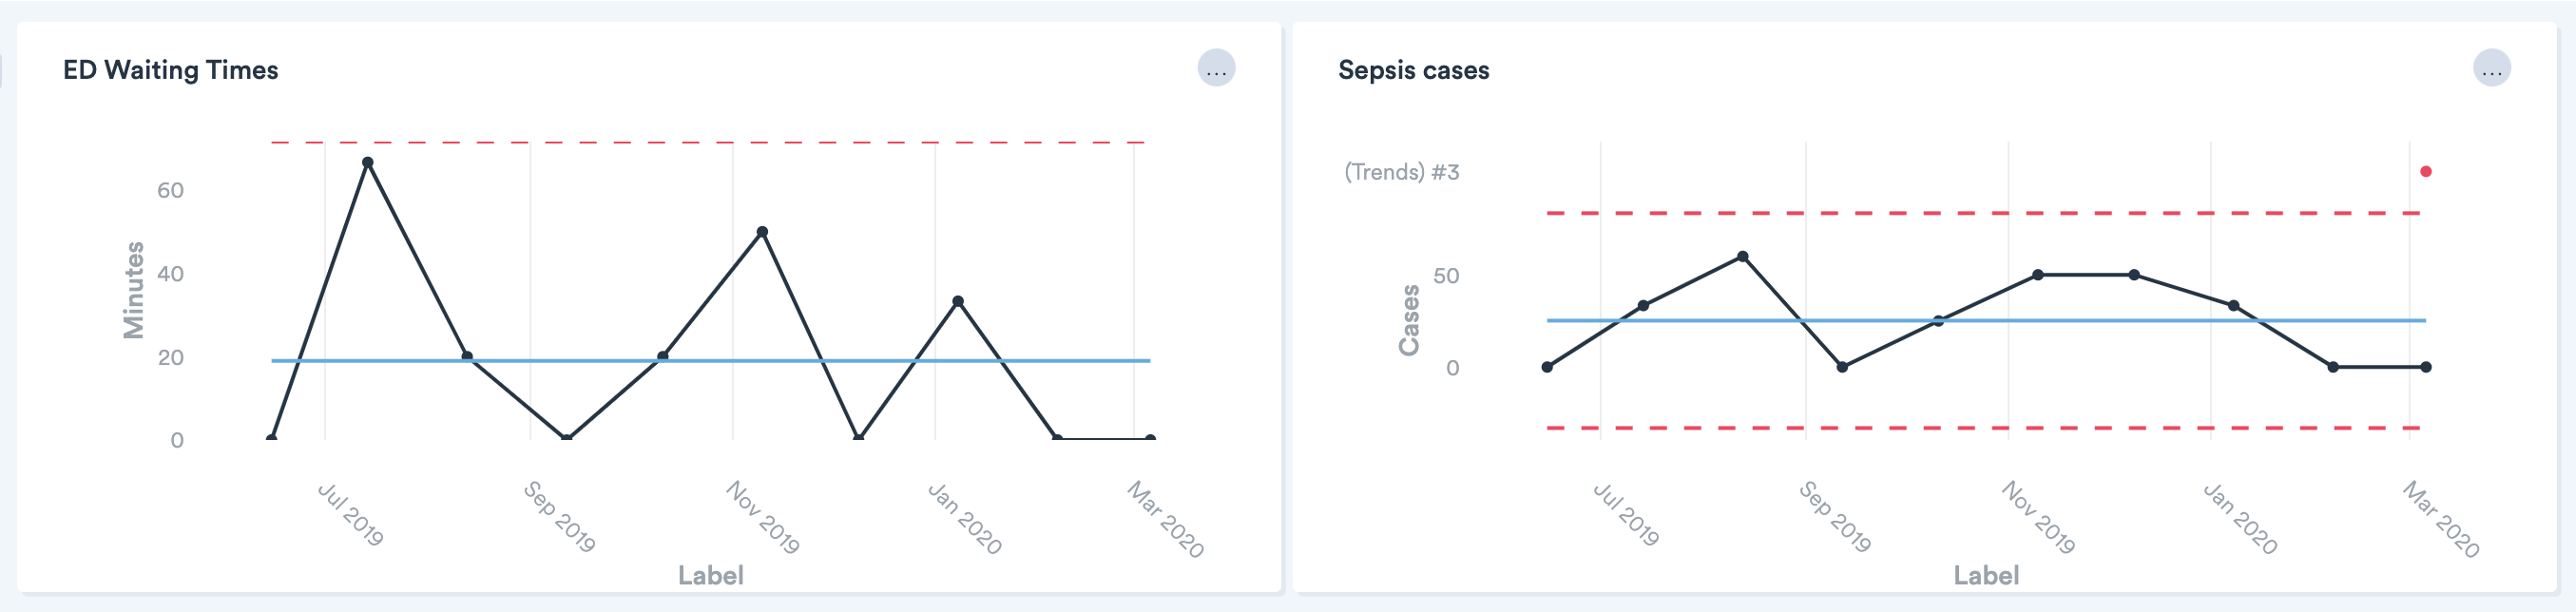
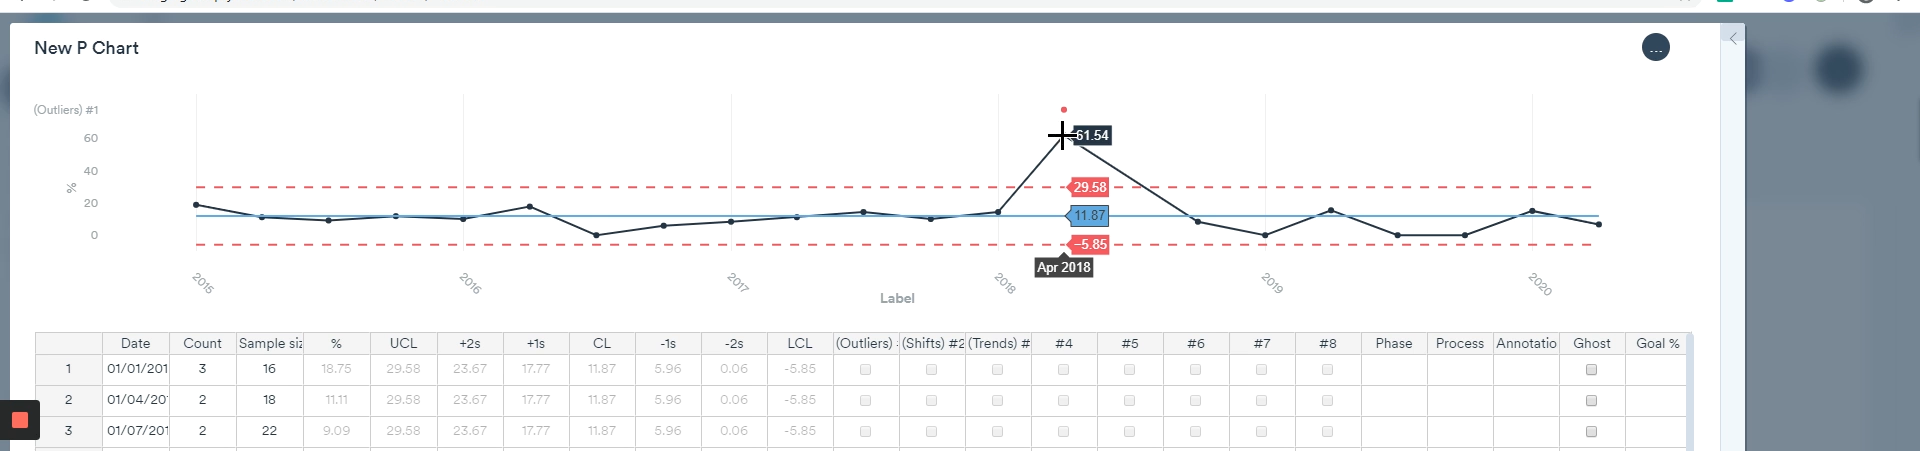
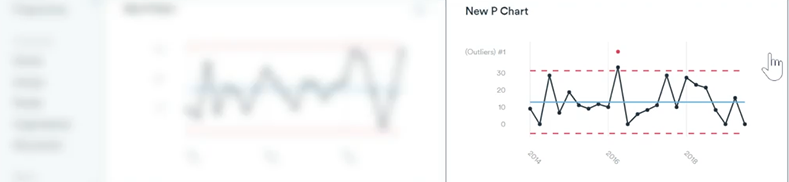
Monitoring quality metrics
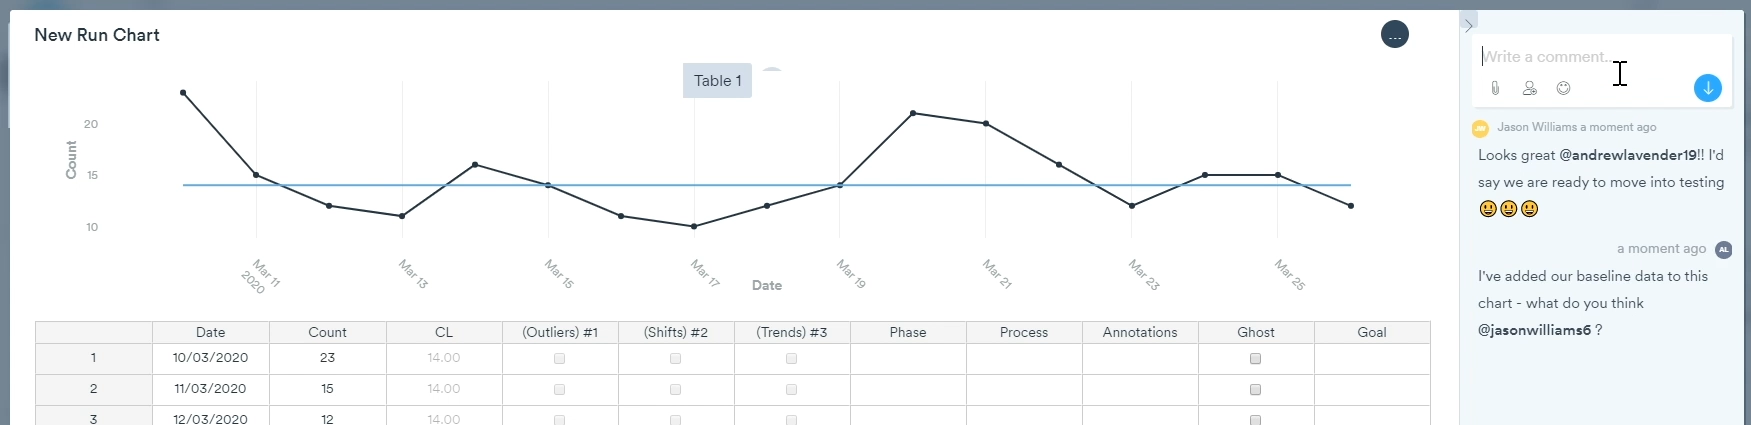
Team communication & feedback with comments & mentions
Custom collections and aggregations of charts
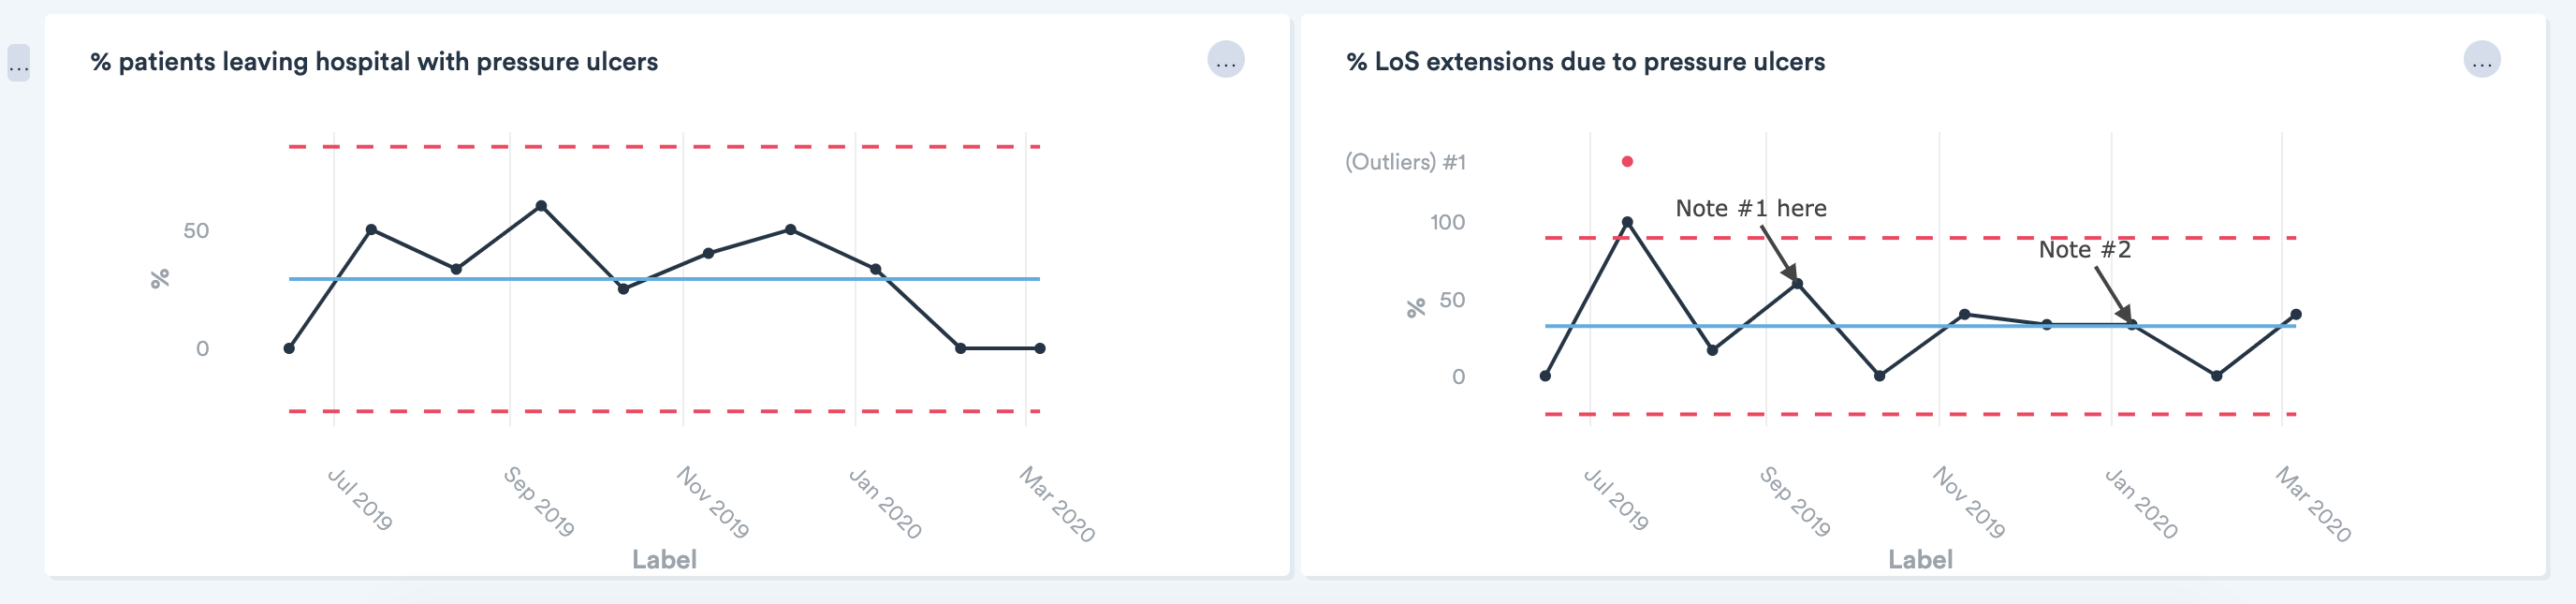
Visualise all your measures on one page
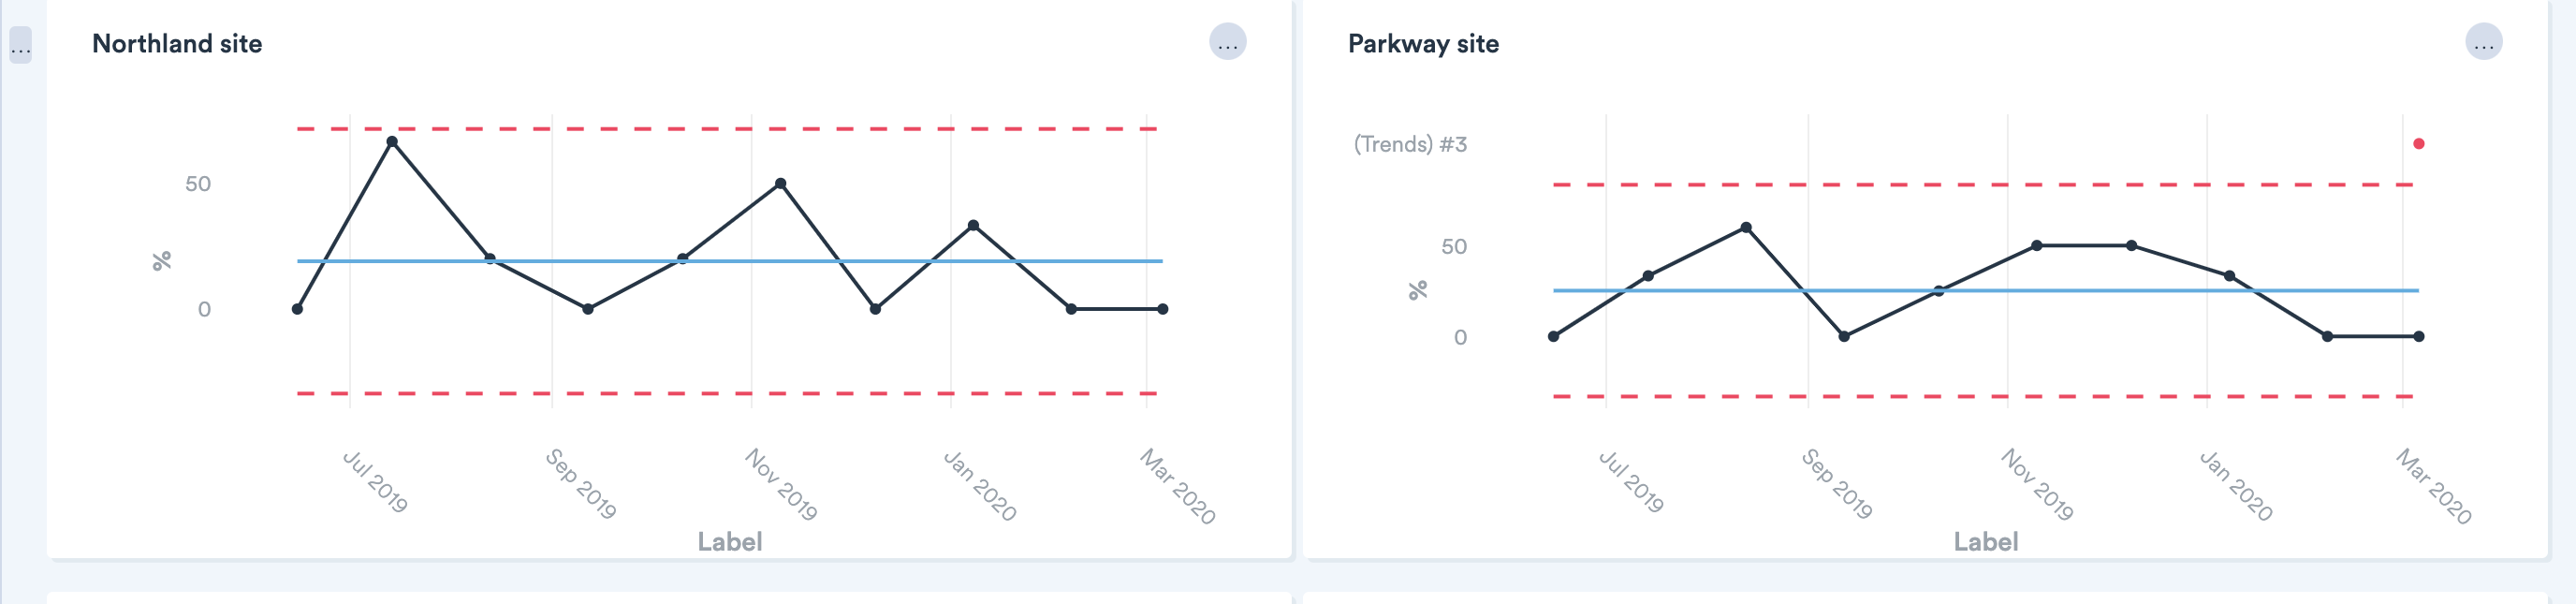
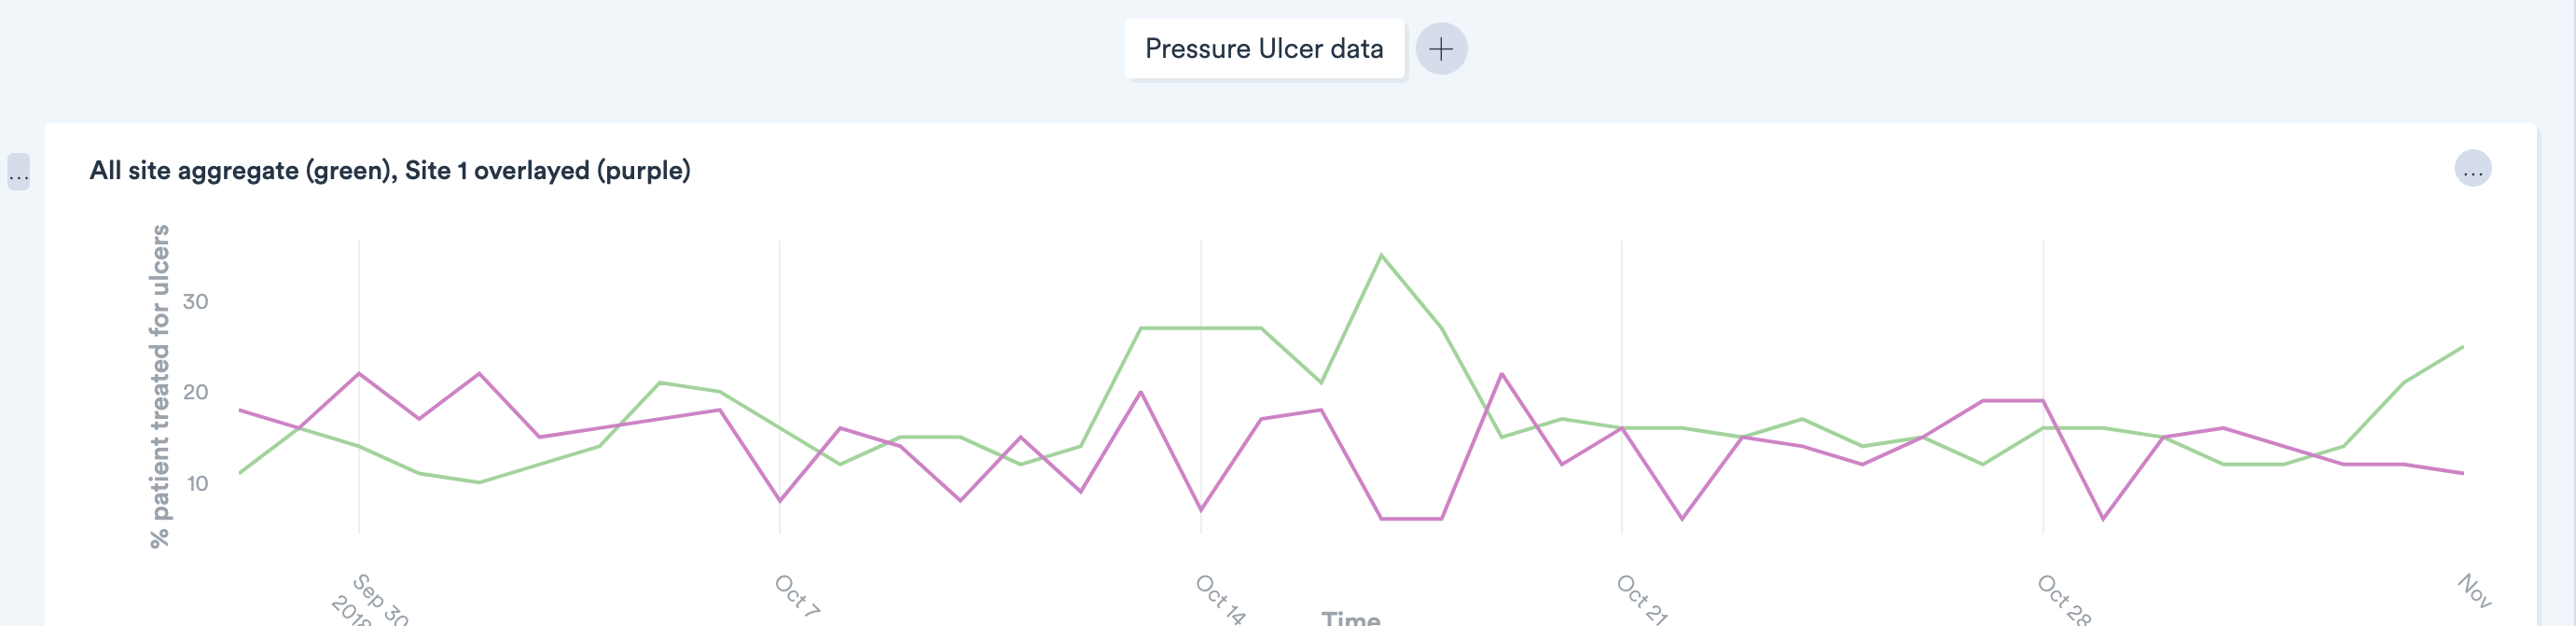
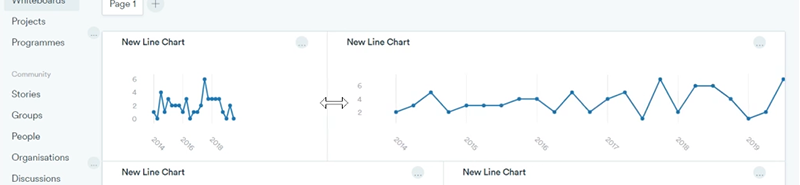
Easily compare data from multiple sites (with small multiple...
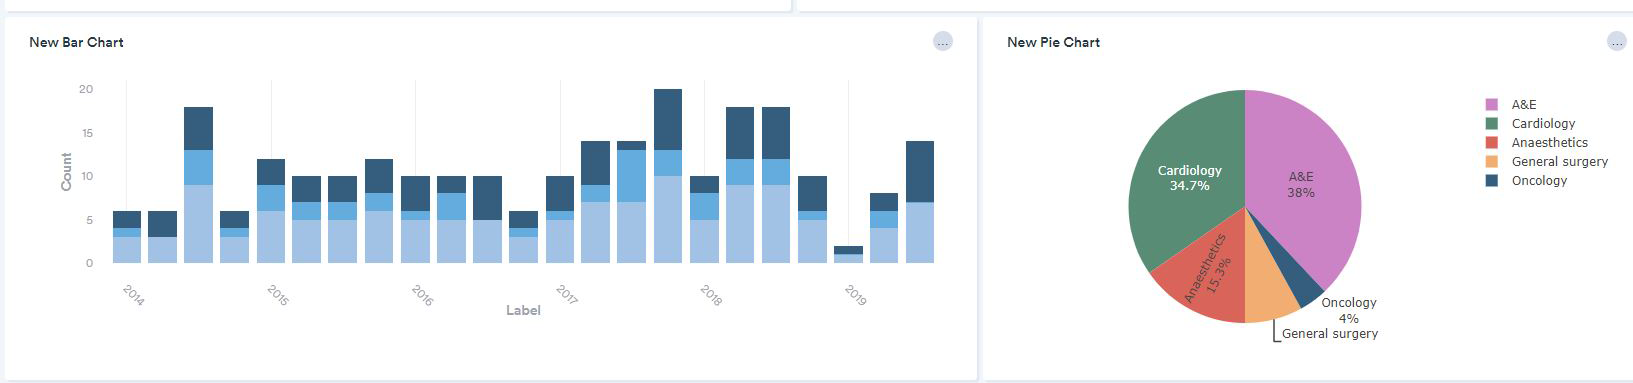
New charts - Bar, Line and Pie
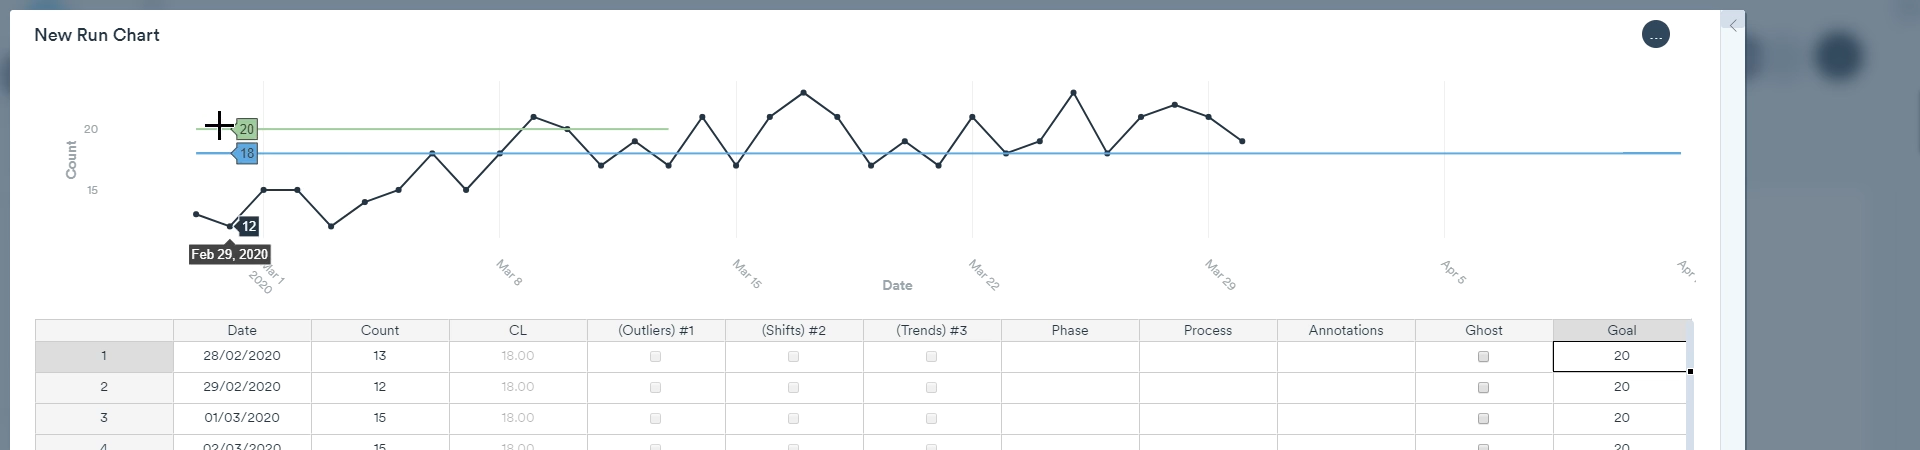
Adding goal lines to charts
Ghost data points and add chart annotations
Customising the look of your chart
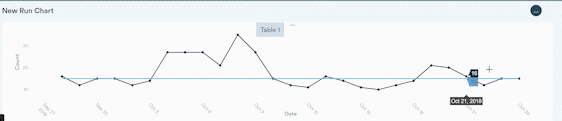
Speed and ease of creating a chart and adding data
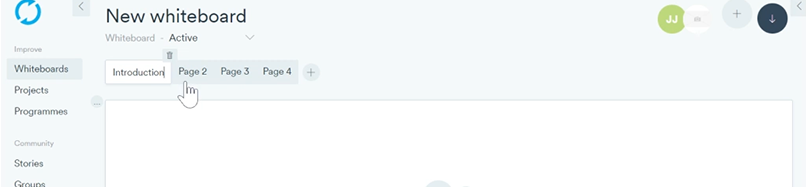
Whiteboards - New Pages

Whiteboards - Drag & Drop
Whiteboards - Resizing cards
Whiteboards - Expanding Cards
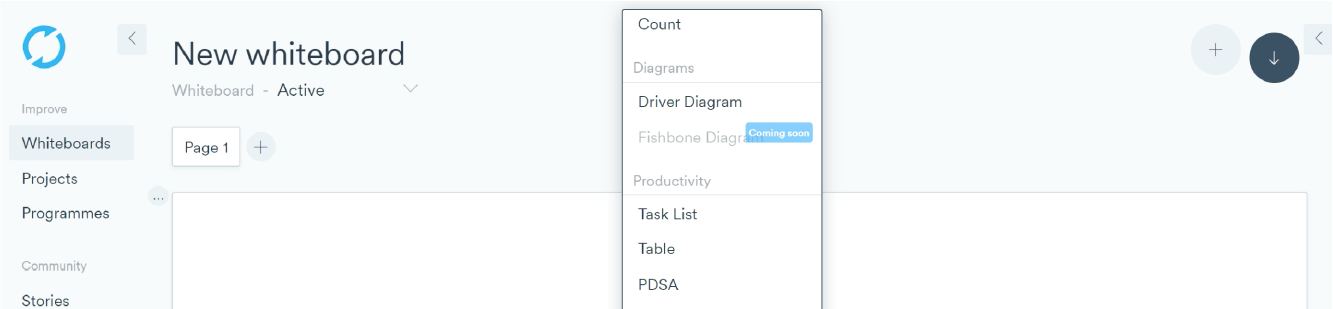
Whiteboards - Improvement Tools List

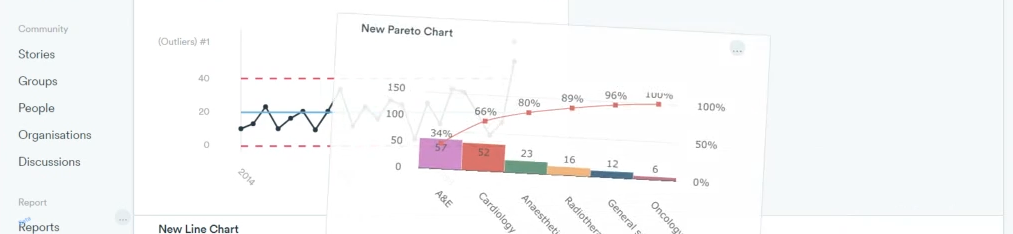
Introducing ... Pareto Charts!


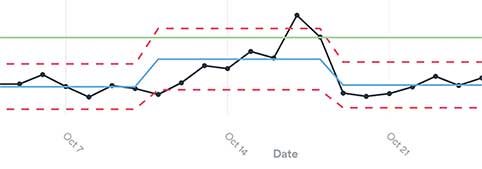
Major SPC charting upgrade