Start improving with Life QI today
Full access to all Life QI features and a support team excited to help you. Quality improvement has never been easier.

Organisation already using Life QI?
Sign-up
We are completely rebuilding SPC charts based on user feedback. The result will make charts easier to create, add data to and configure to look just the way you want them.
This upgrade will see a number of existing features completely re-imagined and the introduction of a range of new chart features. A lot of users have provided feedback in shaping this upgrade and we are super excited about the improvements set to come to SPC charts in Life QI.
Headline features of the new charting tools include:
The old method of manually adding rows has gone and data entry is now done on a familiar Excel sheet interface. Pasting has been dramatically improved and copying in and out of the sheet is now possible.
These changes make the process of entering large amounts of data into Life QI easier and more familiar – just like copy/paste in Excel. It couldn’t be simpler!
Users can now turn every line/marker on and off, change line colours and marker colours individually, modify chart and X and Y axis titles and a range of other customisation options to make charting unique to user and organisation preferences.
Check out this preview showing some of the config options that will be available:
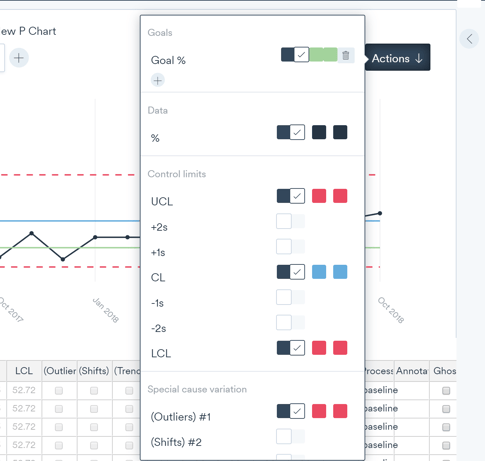
The new customisation options make it possible not just to produce charts the way you like them, but also to allow you to configure them to help focus attention to the areas you want your audience to pay attention to.
Users can add multiple goals and configure options such as colours individually. Goals can also change across the timeline of the charts to represent adjustments or cumulative goals across the full period of data collection.
The new goals feature allows you to visualise the direction of improvement on the chart and progress being made towards realising that goal. This reduces the time needed to evaluate the chart and makes demonstrating the realisation of your targets effortless.
Check out this work in progress example showing a green goal line, with blue centre line and red upper and lower control limits:
Following lots of feedback from users we are now introducing the option to switch between chart types, allowing you to visualise your data using a range of different chart types. So a P chart can become a C chart, and you can even turn your P chart into a Pareto chart!
Picking the most appropriate chart type from the outset can be tricky, especially if it's unclear what data you will be able to collect. This new feature will allow you to create your data table with the data you have, and then switch between different chart types to select the most appropriate visualisation.
Exporting of chart images has been rebuilt and users can now define the size of their export image (A1, A2, A3, A4, A5) and orientation (landscape, portrait) to make sure they can make the best use of space in their target platform (PowerPoint, Word etc).
The speed of exports is also now near instant.
Aggregate charting has been rebuilt and can now be implemented to aggregate up through any number of levels of charts.
Small multiples displays of charts are also now available on all aggregate charts and turn on with the click of a button.
The new small multiple display will allow you to bring together related charts all on one page, making analysis simpler than ever before in Life QI. You will be able to create small multiples views of charts within a project, or on a programme that pulls together charts from multiple projects.
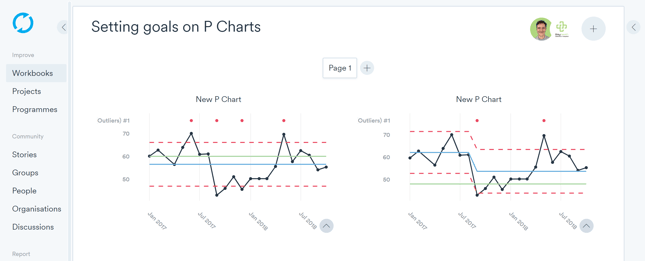
Check out this example of two P charts side by side, the scale on the Y axis are both aligned to allow the data to be easily compared:

As these features continue to take shape we will post further details giving you the latest insight into the next generation of SPC charting on Life QI. Stay tuned ...
Full access to all Life QI features and a support team excited to help you. Quality improvement has never been easier.
Organisation already using Life QI?
Sign-up